The Science of Speed to Lead
A review of the major studies on speed to lead, covering what they actually measured, where they converge, and what a working bar looks like, so you can decide whether response time deserves operational attention.
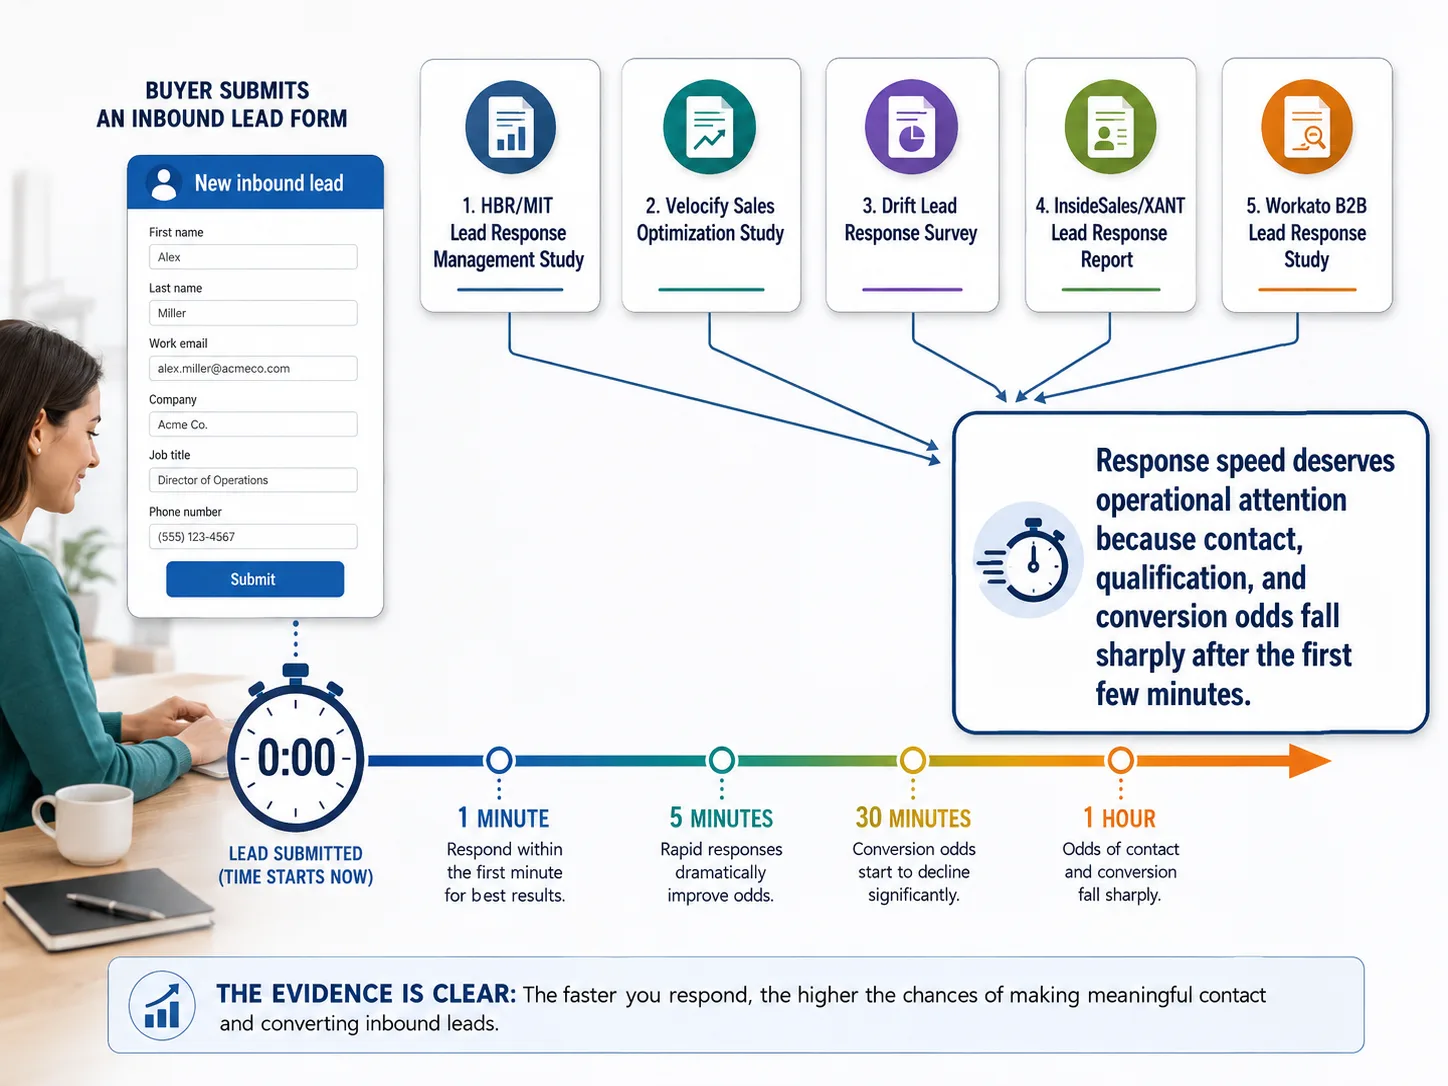
If you run a service business, agency, or inbound sales team, you probably don't need another article telling you to follow up faster.
You already know speed matters. The real question is whether it matters enough to change how your team operates.
This article walks through the research (HBR/MIT, Velocify, Drift, XANT, and Workato) so you can decide whether response time deserves operational attention.
The studies the claim rests on
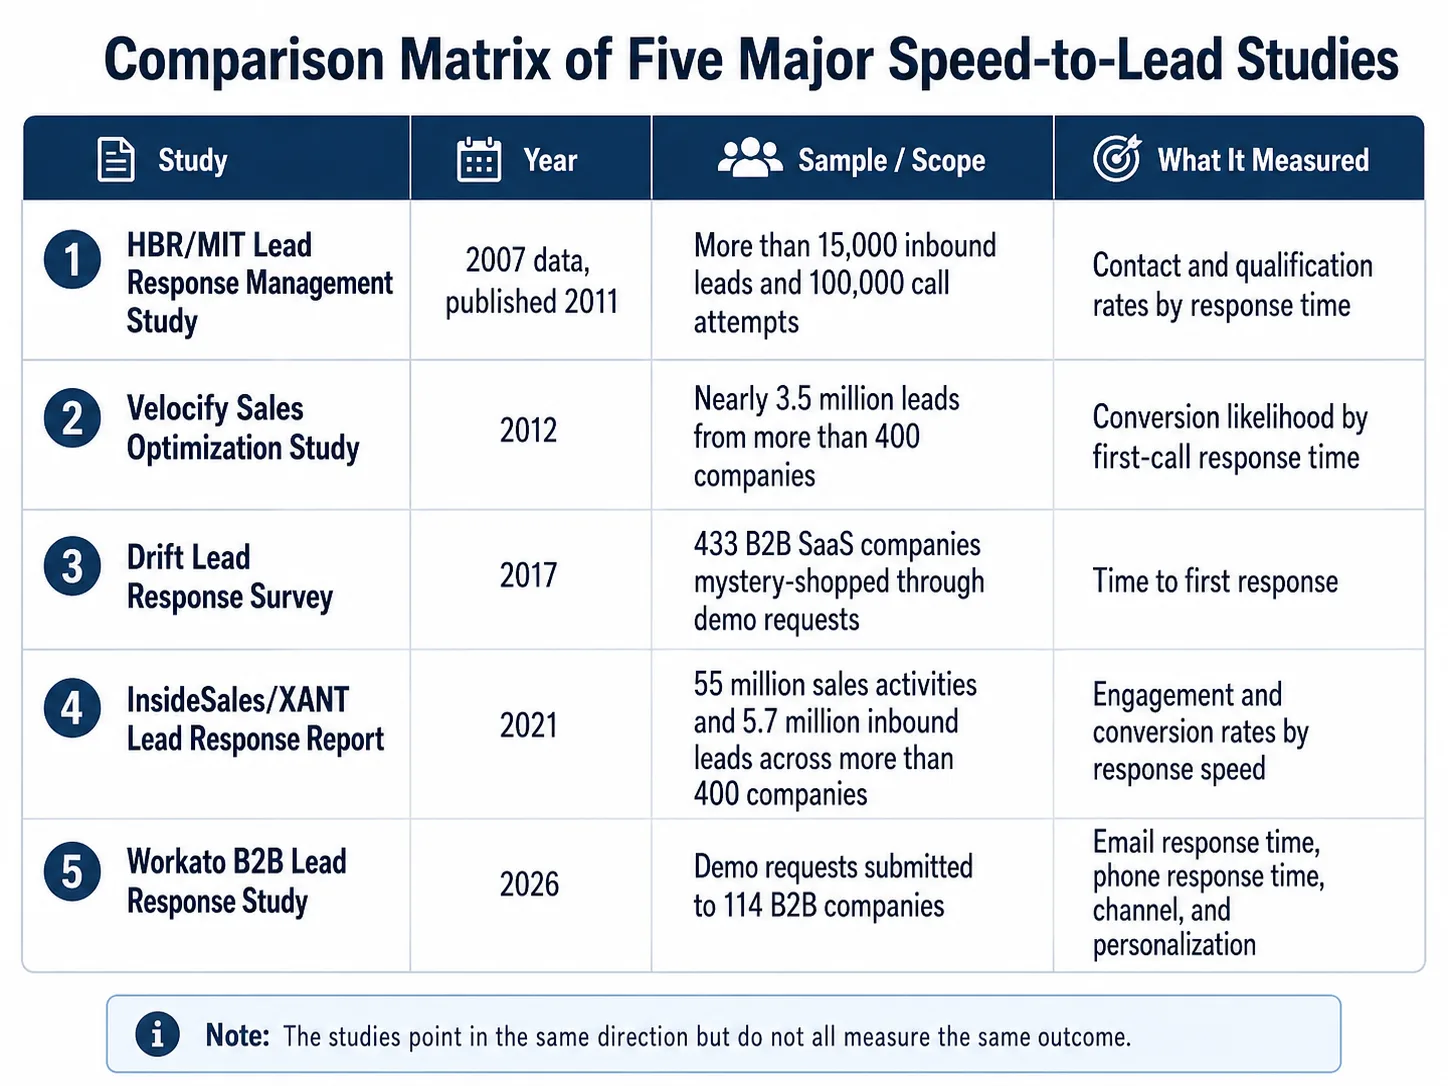
- Harvard Business Review / MIT Lead Response Management Study (2007, published 2011). James Oldroyd, then an MIT Faculty Fellow, with Kristina McElheran and David Elkington analyzed 15,000+ inbound leads and 100,000 call attempts, measuring contact and qualification rates against response time. Published in HBR as "The Short Life of Online Sales Leads."
- Velocify Sales Optimization Study (2012). Velocify analyzed nearly 3.5 million leads from 400+ companies in the first half of 2012, measuring conversion likelihood against first-call response time.
- Drift Lead Response Survey (2017). Drift mystery-shopped 433 B2B SaaS companies by submitting demo requests and tracking time-to-first-response.
- InsideSales/XANT Lead Response Report (2021). XANT (formerly InsideSales) analyzed 55 million sales activities and 5.7 million inbound leads across 400+ companies between 2018 and 2020, measuring engagement and conversion rates against response speed.
- Workato B2B Lead Response Study (2026). Workato submitted demo requests to 114 B2B companies and tracked email and phone responses, measuring response time, channel, and personalization.
Across the five, the shape is consistent: contact and qualification odds drop sharply in the first few minutes, and most companies still respond far slower than that.
The metric varies more than the headline suggests. HBR/MIT and XANT measure whether the rep reached the lead (contact) and whether the lead fit (qualification). Velocify measures conversion likelihood, closer to revenue.
Drift and Workato measure response time alone, with no conversion data. Same headline, five different things counted.
The curve, in numbers
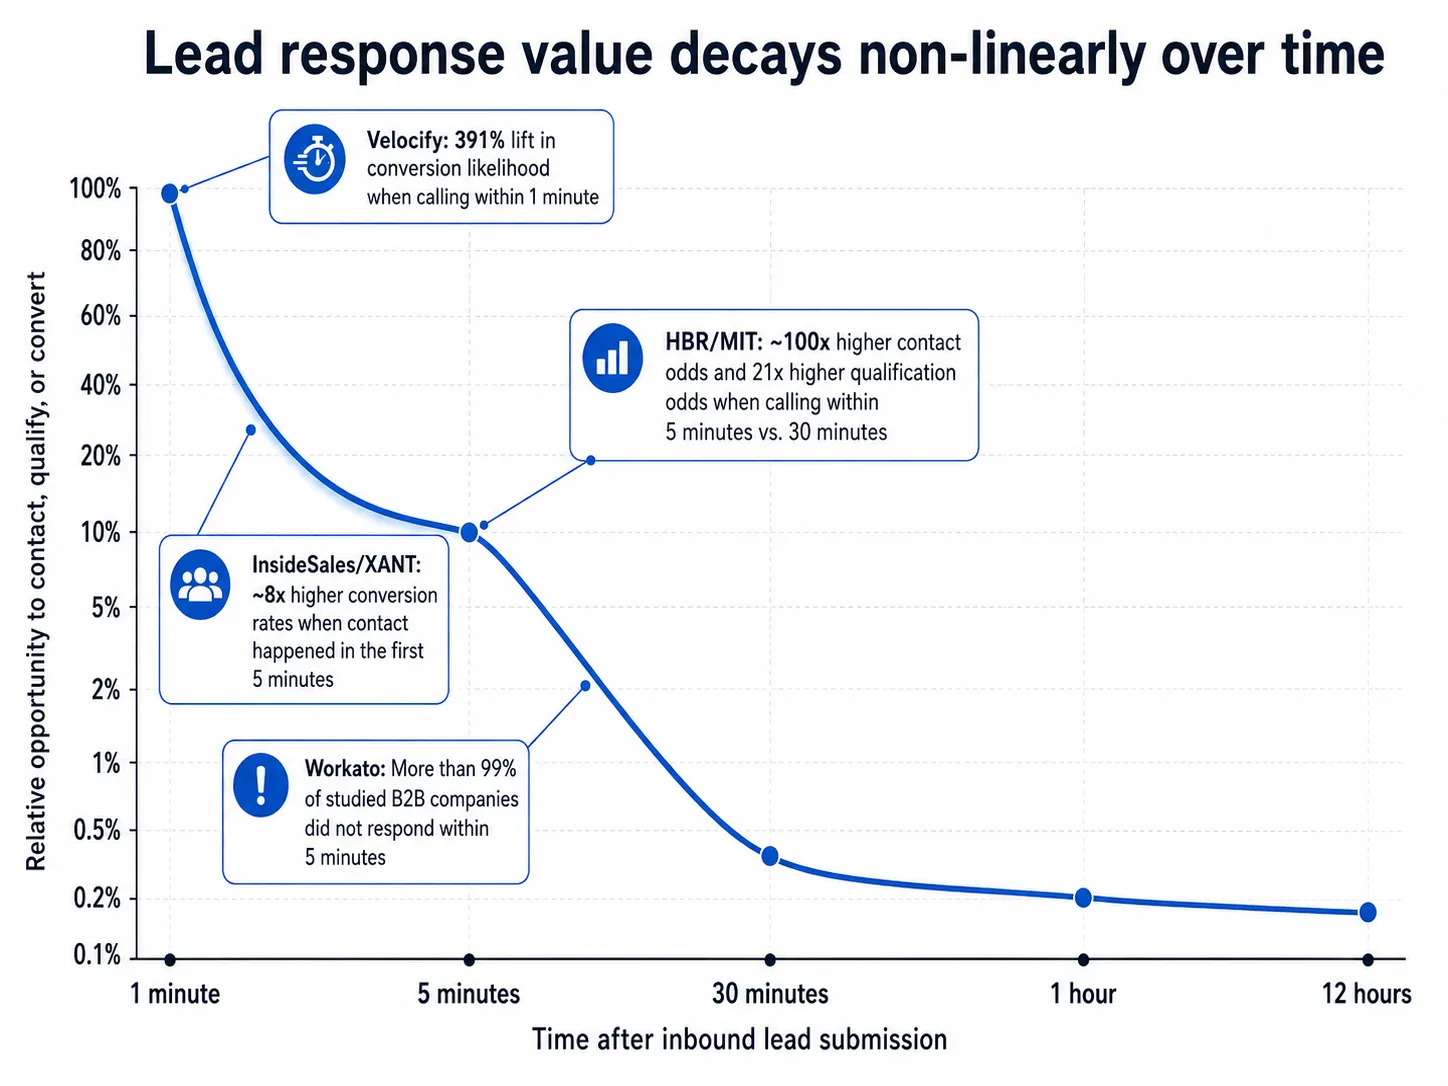
- HBR/MIT: 5 minutes vs 30 minutes. Calling an inbound lead within 5 minutes produced about 100× higher odds of making contact and 21× higher odds of qualifying it than calling 30 minutes later. The 5-to-30-minute gap is the steep section of the curve.
- Velocify: 1 minute vs 30 minutes vs 1 hour. In a dataset of nearly 3.5 million leads, calling within 1 minute produced a 391% lift in conversion likelihood. At 30 minutes the lift was 62%; at 1 hour, 36%. Most of the value sits in the first few minutes; from 30 minutes on, the curve flattens.
- InsideSales/XANT: 5 minutes vs later. Across 5.7 million inbound leads, conversion rates were roughly 8× higher when contact happened in the first five minutes. Only 0.1% of leads were actually engaged in that window.
The shape is non-linear. Most of the decay sits in the first five to thirty minutes, which is also where most teams sit when they say "we respond pretty fast."
Workato's 2026 mystery shop showed the gap from the supplier side: of 114 B2B companies, more than 99% did not respond within five minutes, and the average personalized email arrived nearly 12 hours after the demo request.
Why speed actually moves the outcome
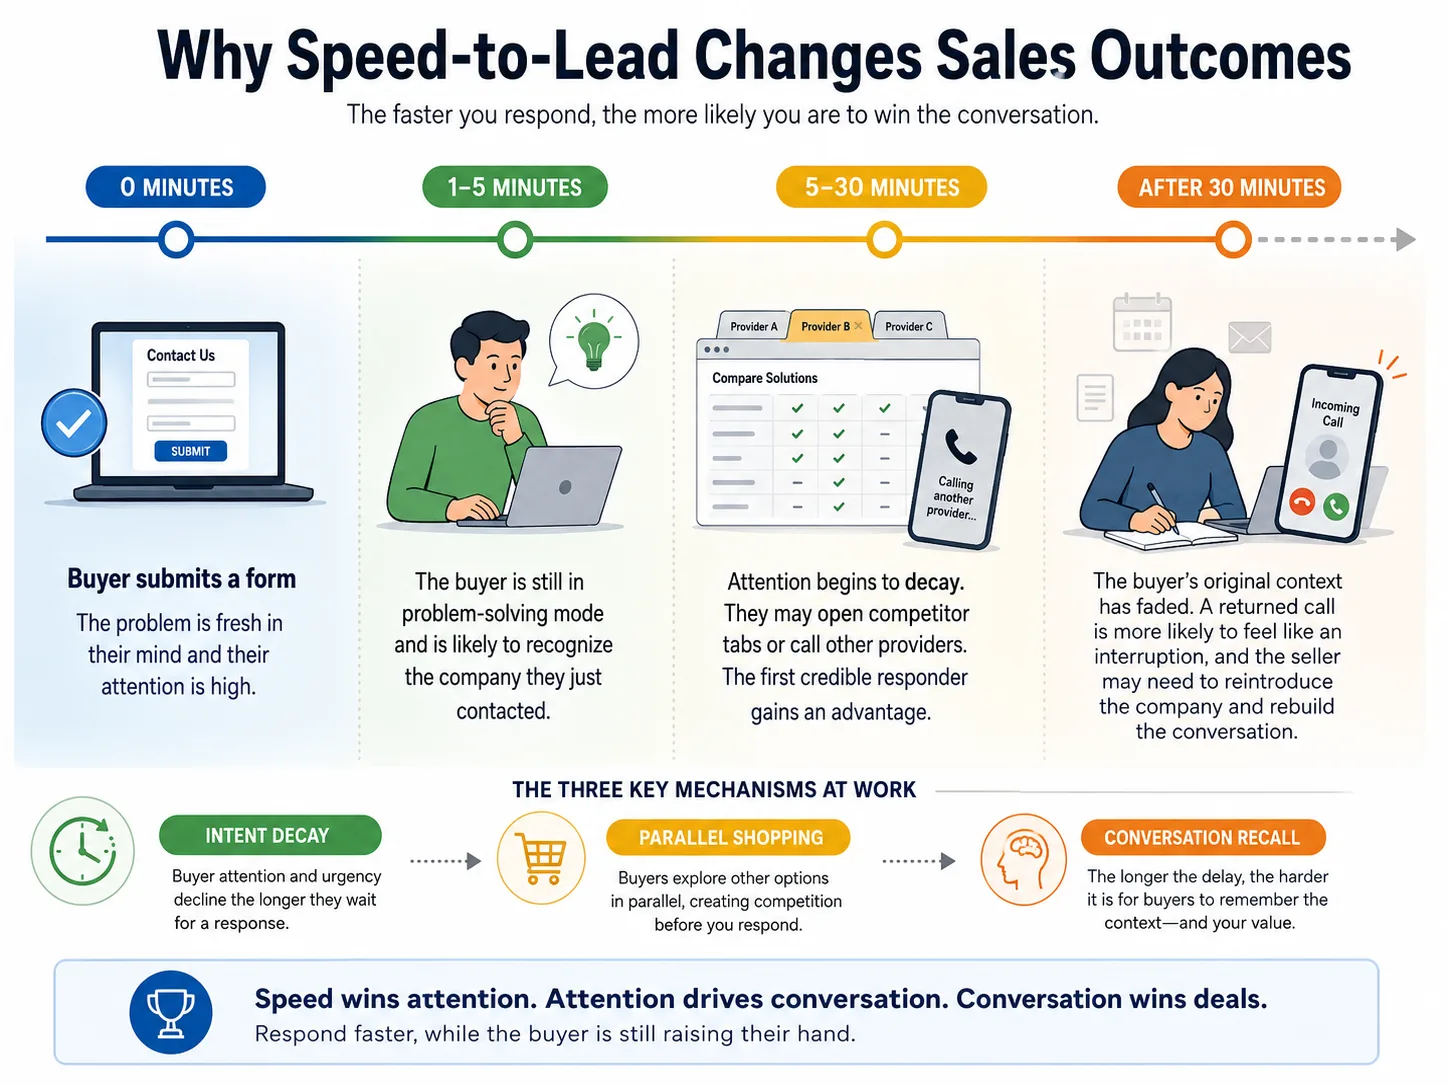
The numbers describe the curve. Three mechanisms produce the shape, and they show up across both B2B and B2C inbound.
- Intent decay. When a buyer fills out a form, the problem is the most-recent thing in their head. Five minutes later, their attention has been pulled elsewhere. By 30 minutes the energy behind the form fill is gone, and a returned call lands as an interruption. This is the simplest reason Velocify's 1-minute / 30-minute / 1-hour curve has the shape it does.
- Parallel shopping. Buyers don't submit a form to one vendor at a time. In B2B SaaS the prospect has tabs open on three competitors. In home services the homeowner is calling four plumbers. In real estate, healthcare, and financial services, the inbound is almost always part of a comparison set running in parallel. The first credible responder gets the conversation; later responders get voicemail, "we went with someone else," or no answer at all.
- Conversation recall. Even when a later response reaches the buyer, the context has to be rebuilt. The same-minute call gets "yes, I just submitted that. Here's what I'm looking for." Four hours later it gets "remind me which company you are." The first responder talks to a buyer still in problem-solving mode; later responders talk to a buyer who has to re-warm.
If response speed is where you're losing leads, fixing other things won't help much. Better scripts only help on calls you answered. Lower prices only help on proposals the buyer opened. A high close rate only counts the leads you reached.
The ones a faster competitor talked to first never show up in that number. Scripts, pricing, and hiring all happen after the lead is already gone.
What "fast enough" looks like
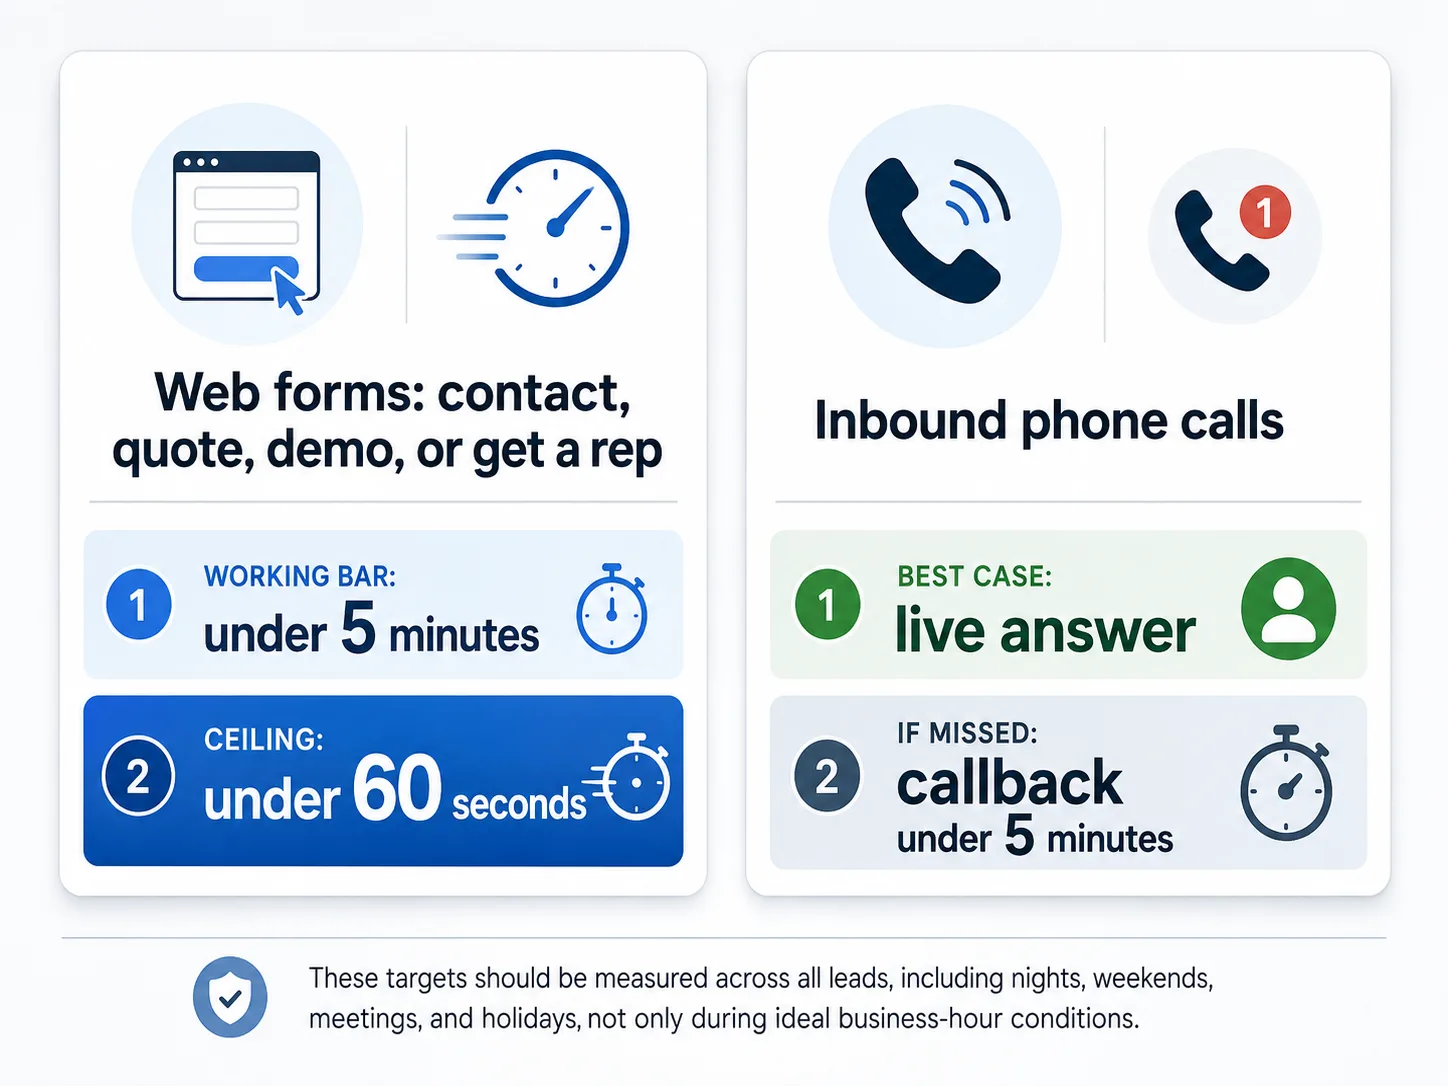
Different inbound channels have different bars, but two cover most cases.
For web forms (contact, quote, demo, "get a rep"), under 5 minutes is the working bar and under 60 seconds is the ceiling. Velocify's curve peaks at the 1-minute response.
For inbound phone calls, live answer if at all possible. A missed call needs a callback under 5 minutes, not the next morning.
Most teams overestimate how fast they are. The number a leader usually quotes ("we respond within a few minutes") is the best case: Tuesday at 11am, everyone at their desk.
The real number is the median across the last 30 days, including the leads that came in at 11pm, on Saturday, during your sales meeting, and over the long weekend. Until you've pulled it, you don't know where you sit.
The honest limits
Speed gets you to the conversation, but the conversation still has to land. A fast call with the wrong pitch still loses.
Speed won't rescue a lead that was never going to buy; a content download isn't a five-minute callback opportunity.
In long B2B cycles, speed preserves access to the buying committee but can't compress a six-month decision. The curve still applies to almost all of your inbound. These are the edges.
How to find your real number
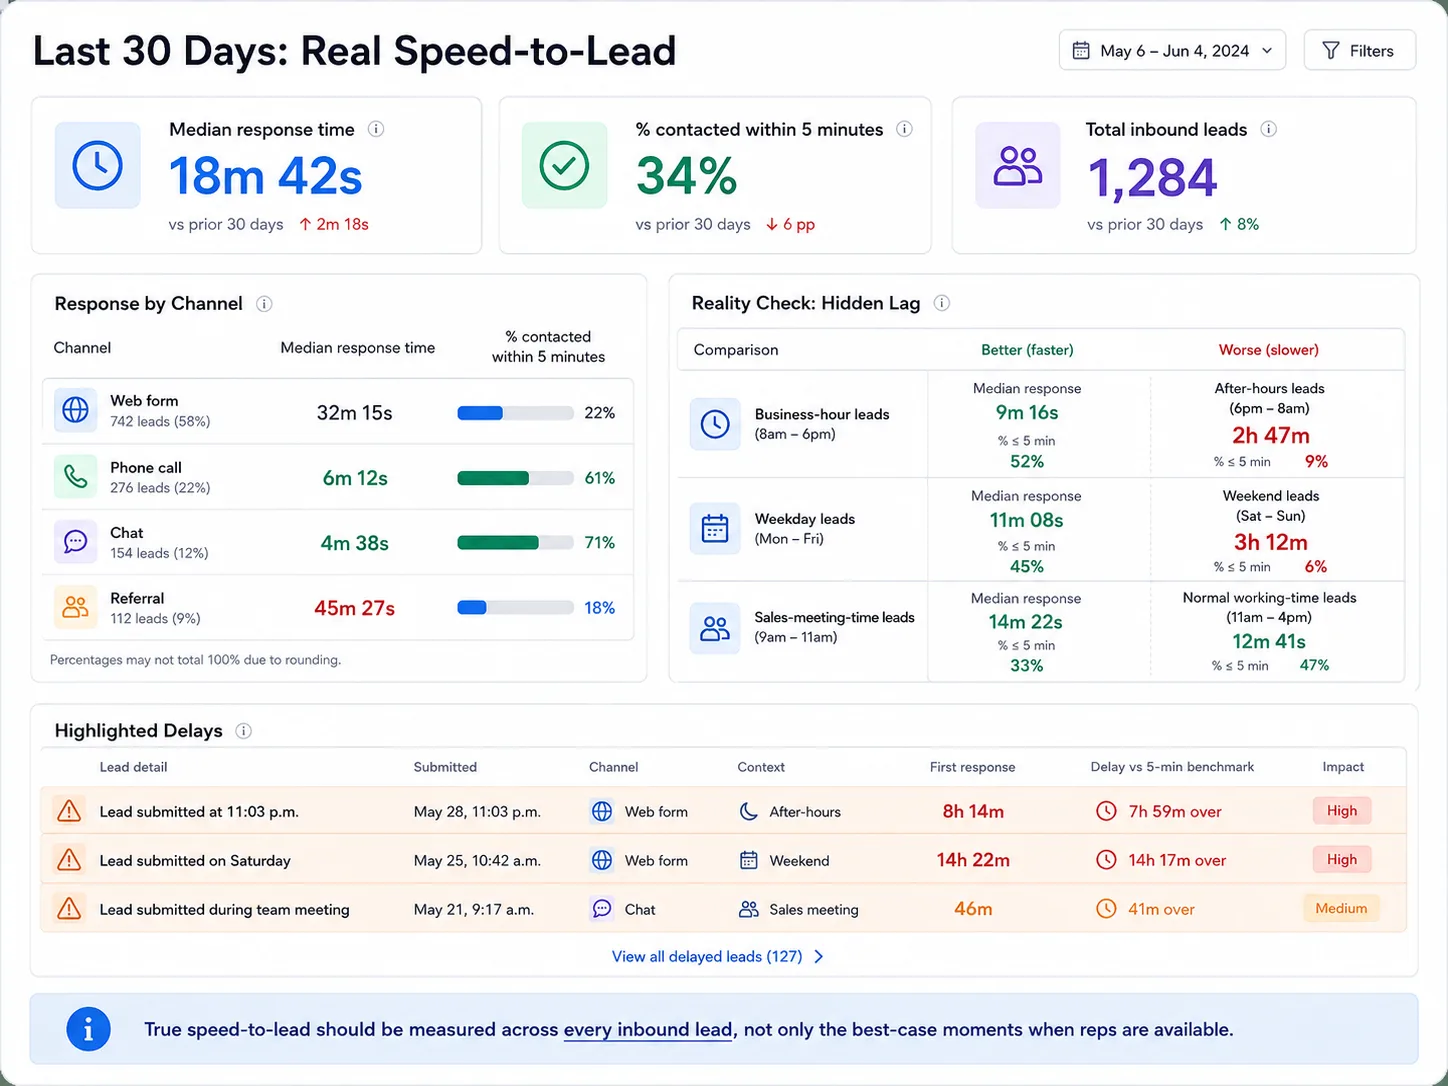
Pull the last 30 days of inbound from your CRM. Find the median response time across every channel, every shift, every weekend. If it's over the five-minute bar, the curve above is your funnel.
For a concrete implementation example, see how this benchmark can be applied to digital lead response for pool repair companies: rapid text and email follow-up, repair-aware qualification, and an explicit handoff to a person for diagnosis, estimates, and technical judgment.